

NOAA, 2014
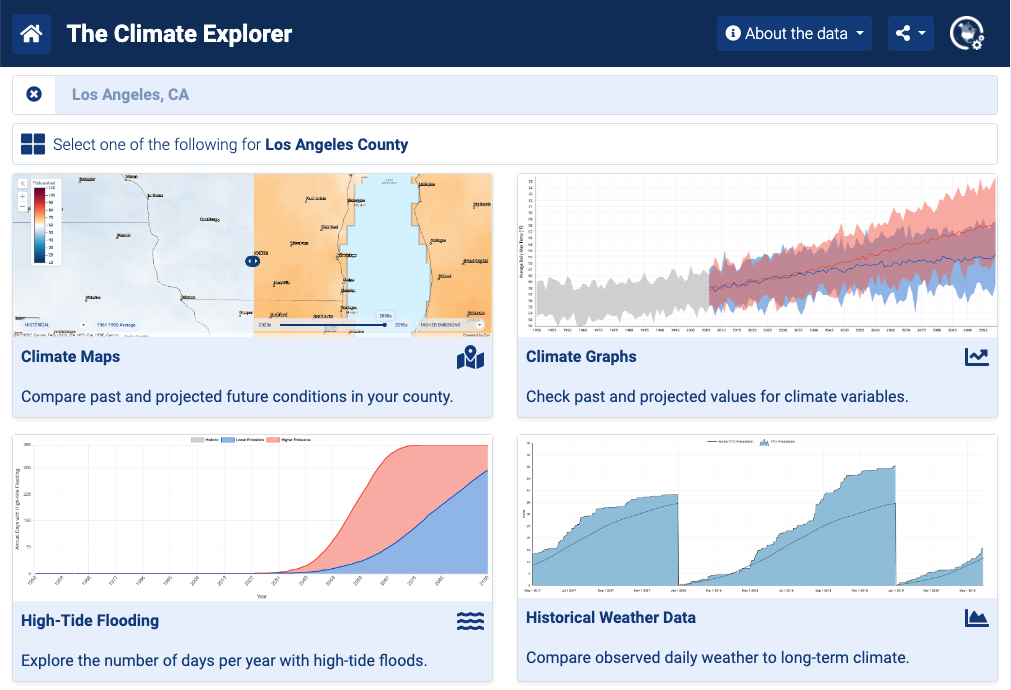
The Climate Explorer gives users a way to check how climate conditions in the United States are projected to change over the coming decades. This information—derived from global climate models—is available for counties and county-equivalents for all 50 states and U.S. territories in the United States.
Built to accompany the U.S. Climate Resilience Toolkit, Climate Explorer graphs projections for two possible futures: one in which humans drastically reduce and stabilize global emissions of heat-trapping gases (labeled Lower emissions, also known as RCP4.5), and one in which we continue increasing emissions through the end of the 21st century (labeled Higher emissions, also known as RCP8.5). Note that only higher emissions projections are available for Alaska. Decision makers can check climate projections based on these two plausible futures and then plan according to their tolerance for risk and the timeframe of their decisions.
For the contiguous United States, the tool also displays observations of climate variables from 1950 to 2013. Users can compare observations to modeled history (results called hindcasts, or projections generated for the past) for the same period. Checking how observations compare to modeled history provides some insight on the models’ collective ability to reproduce past conditions. For temperature-related variables, the range of observations are generally within the envelope of modeled history (hindcasts), indicating model skill in simulating observed conditions. For some variables—especially precipitation-related variables—comparing observations with hindcasts reveals limitations of the models.