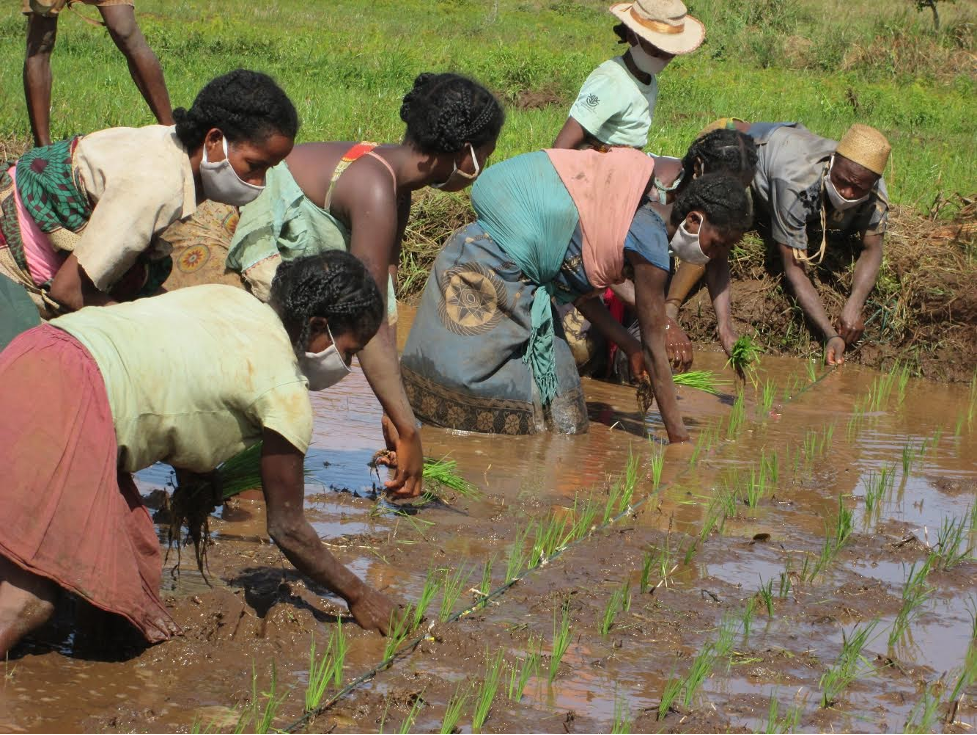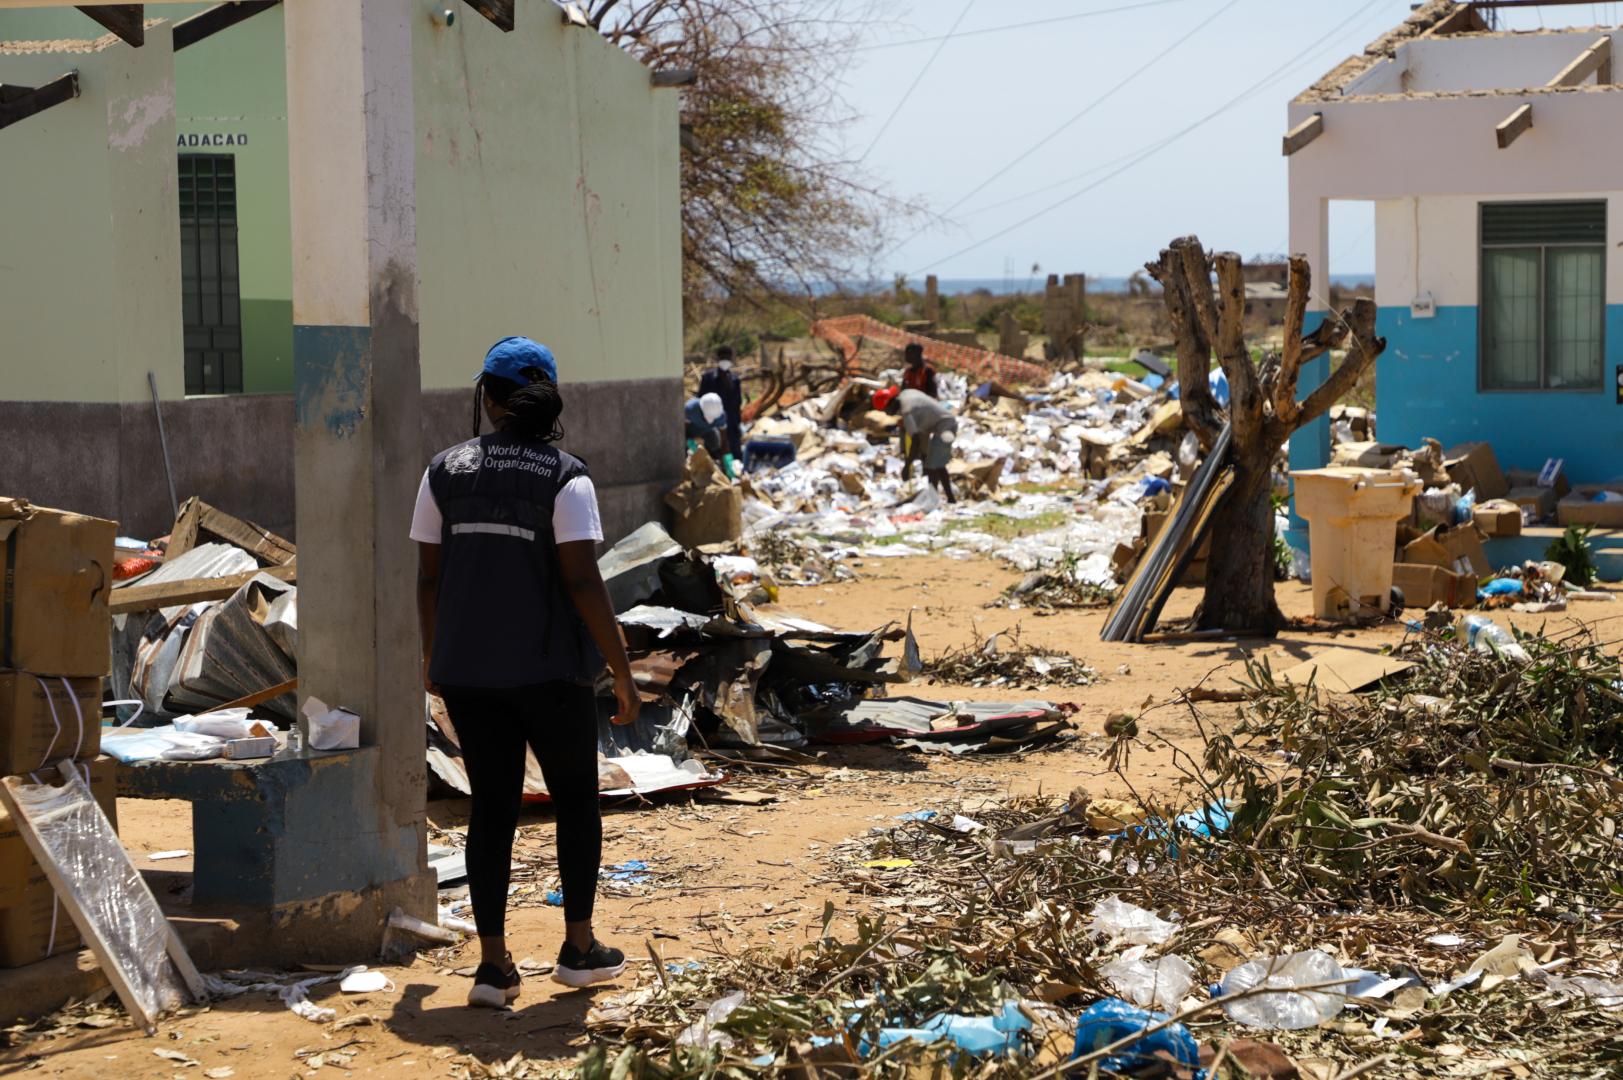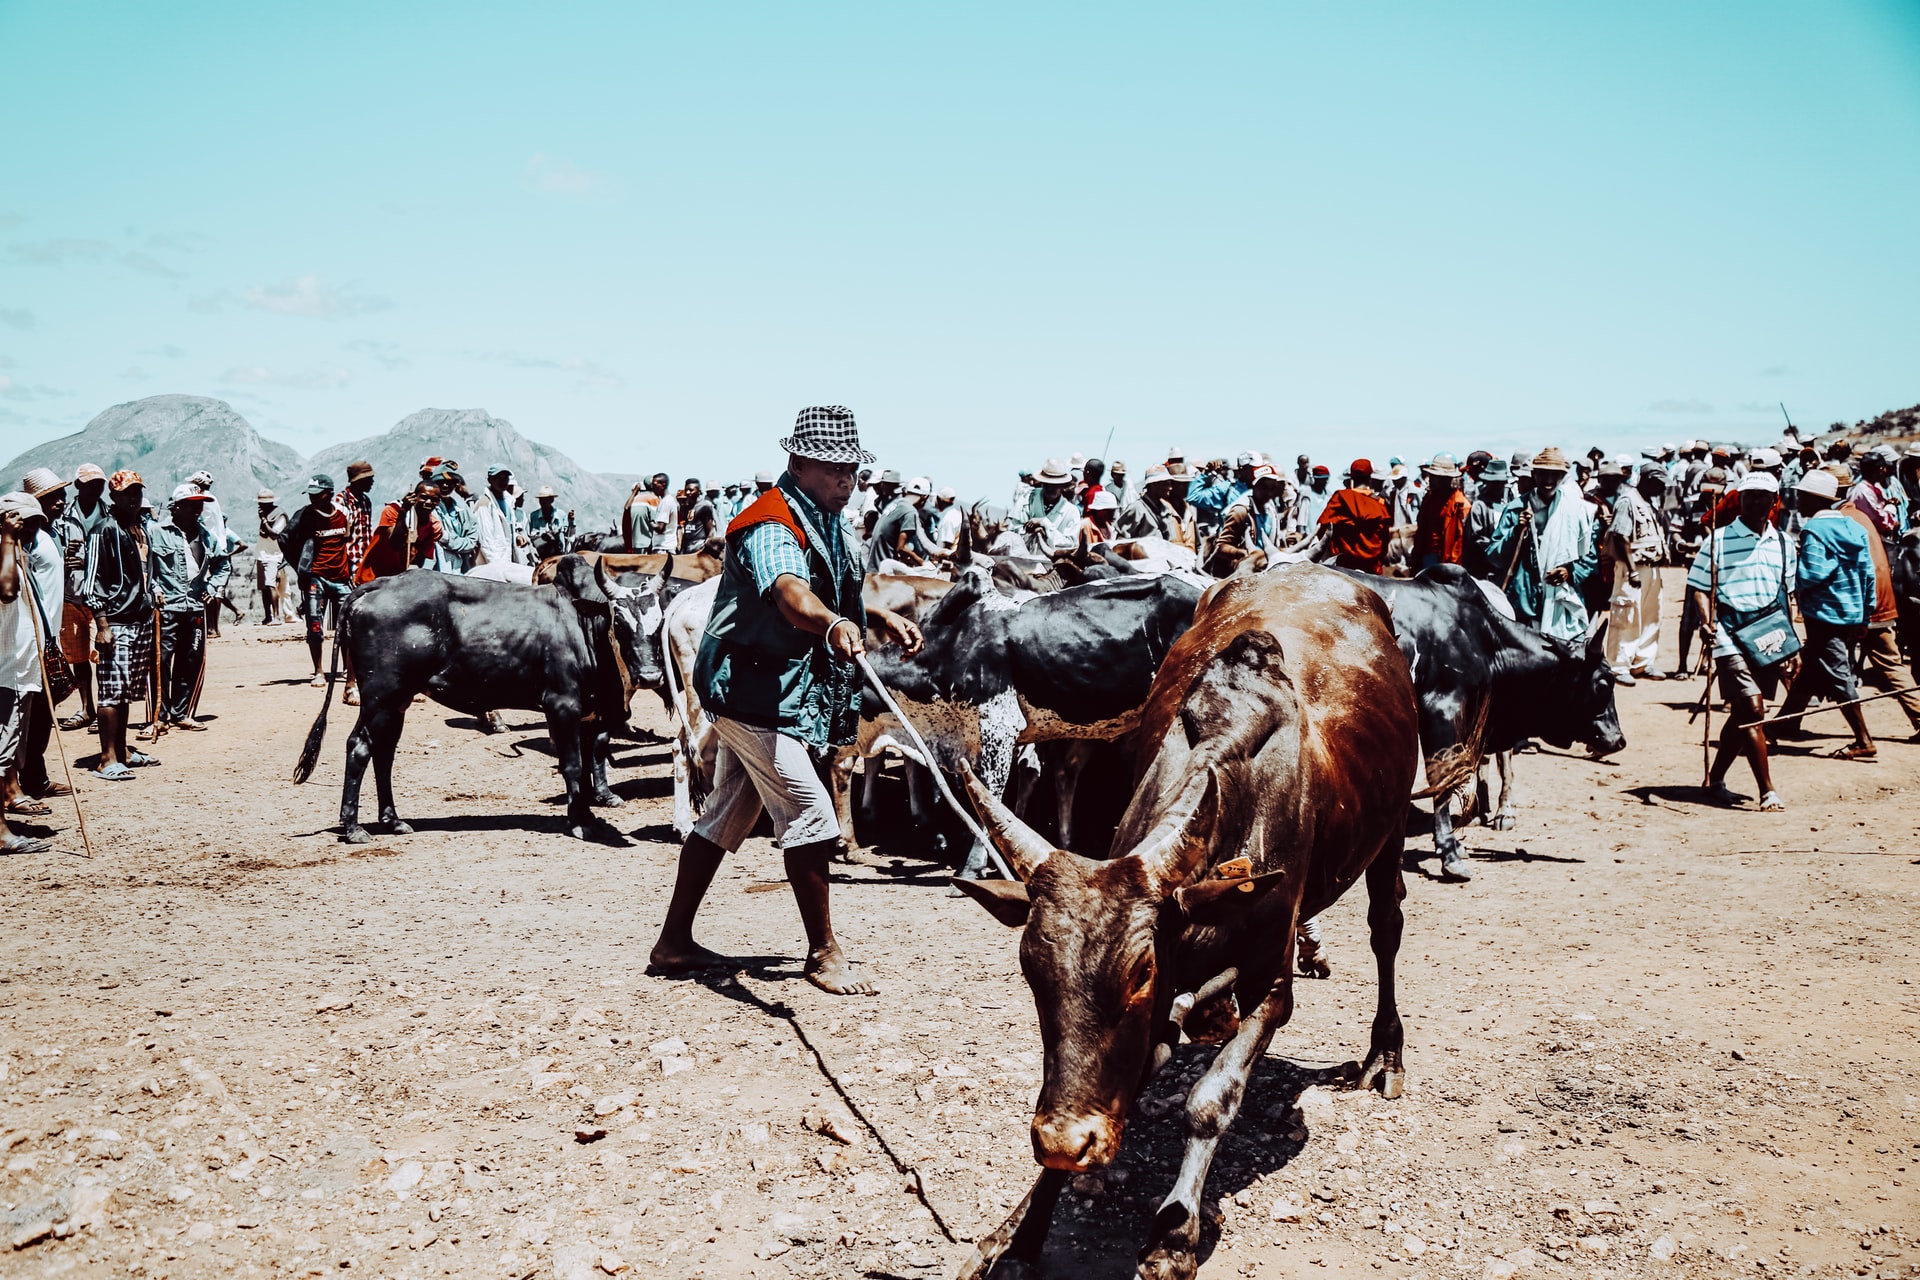

Madagascar is a large island nation, located off the eastern coast of Africa in the Indian Ocean. The highland plateau across the centre of Madagascar has created diverse ecosystems across the island (1). Whilst the climate is generally tropical, there are significant regional variations. Most notably, it is largely wet in the north and east, and dry in the south and west (2). Madagascar’s economy is mostly dependent upon agriculture, fishery and livestock production. There are some development challenges in Madagascar, which make it increasingly vulnerable to climate change (1). Furthermore, it is hit by tropical cyclones annually from December to May (2).
Climate change is expected to cause rising temperatures, changing precipitation patterns (including flood and drought), sea level rise, and extreme weather events (including tropical cyclones). Indeed, many of these impacts are already being observed in Madagascar (3). For human health, these changes are likely to incur significant burdens, such as food and water insecurity, displacement, and damage to public health systems (1).
As a least developed country, Madagascar’s greenhouse gas emissions are very small. Yet in their Nationally Determined Contribution (NDC), they commit to reducing their greenhouse gas emissions by 14% by 2030 compared with its business as usual scenario. Adaptation is a major priority for Madagascar, considering its high vulnerability to climate change. In terms of health adaptation, priority actions in the NDC include evaluating the links between climate change and the migration of vector-borne diseases and evolution of acute respiratory infections, and the implementation of early warning systems for health (3).
Country-specific projections are outlined up to the year 2100 for climate hazards under a ‘business as usual’ high emissions scenario compared to projections under a ‘two-degree’ scenario with rapidly decreasing global emissions (see Figures 1–5). The climate model projections given below present climate hazards under a high emissions scenario, Representative Concentration Pathway 8.5 (RCP8.5 – in orange) and a low emissions scenario (RCP2.6 – in green). 1 1Model projections are from CMIP5 for RCP8.5 (high emissions) and RCP2.6 (low emissions). Model anomalies are added to the historical mean and smoothed.
The text describes the projected changes averaged across about 20 global climate models (thick line). The figures 2 2Analysis by the Climatic Research Unit, University of East Anglia, 2018. also show each model individually as well as the 90% model range (shaded) as a measure of uncertainty and the annual and smoothed observed record (in blue).3 3Observed historical record of mean temperature is from CRU-TSv3.26 and total precipitation is from GPCC. Observed historical records of extremes are from JRA55 for temperature and from GPCC-FDD for precipitation. In the following text the present-day baseline refers to the 30-year average for 1981–2010 and the end-of-century refers to the 30-year average for 2071–2100.
Modelling uncertainties associated with the relatively coarse spatial scale of the models compared with that of small island States are not explicitly represented. There are also issues associated with the availability and representativeness of observed data for such locations.
Under a high emissions scenario, the mean annual temperature is projected to rise by about 3.4°C on average by the end-of-century (i.e. 2071–2100 compared with 1981–2010). If emissions decrease rapidly, the temperature rise is limited to about 1°C.
Total annual precipitation is projected to decrease by about 4% on average under a high emissions scenario, although the uncertainty range is large (-20% to +11%). If emissions decrease rapidly, there is little projected change on average: a decrease of 2% with an uncertainty range of -10% to +5%.
The percentage of hot days4 4A ‘hot day’ (‘hot night’) is a day when maximum (minimum) temperature exceeds the 90th percentile threshold for that time of the year. is projected to increase substantially from about 15% of all observed days on average in 1981–2010 (10% in 1961–1990). Under a high emissions scenario, about 80% of days on average are defined as ‘hot’ by the end-of-century. If emissions decrease rapidly, about 40% of days on average are ‘hot’. Note that for the past few years the models tend to over-estimate the observed increase in hot days. Slightly larger increases are seen in hot nights (not shown).
Under a high emissions scenario, the proportion of total annual rainfall from very wet days5 5The proportion (%) of annual rainfall totals that falls during very wet days, defined as days that are at least as wet as the historically 5% wettest of all days (about 30% for 1981–2010) could increase by the end-of-century (to about 35% on average with an uncertainty range of about 25% to 50%), with little change if emissions decrease rapidly. These projected changes are accompanied by little or no change in total annual rainfall (see Figure 2).
The Standardized Precipitation Index (SPI) is a widely used drought index which expresses rainfall deficits/excesses over timescales ranging from 1 to 36 months (here 12 months, i.e. SPI12).6 6SPI is unitless but can be used to categorize different severities of drought (wet): above +2.0 extremely wet; +2.0 to +1.5 severely wet; +1.5 to +1.0 moderately wet; +1.0 to +0.5 slightly wet; +0.5 to -0.5 near normal conditions; -0.5 to -1.0 slight drought; -1.0 to -1.5 moderate drought; -1.5 to -2.0 severe drought; below -2.0 extreme drought. It shows how at the same time extremely dry and extremely wet conditions, relative to the average local conditions, change in frequency and/or intensity.
SPI12 values show little projected change from about zero on average, though year-to-year variability remains large. A few models indicate slightly larger decreases (more frequent/intense dry/drought events) or increases (more frequent/ intense wet events).
It is anticipated that the total number of tropical cyclones may decrease towards the end of the century. However, it is likely that human-induced warming will make cyclones more intense (an increase in wind speed of 2–11% for a mid-range scenario (i.e. RCP4.5 which lies between RCP2.6 and RCP8.5 – shown on pages 4–5) or about 5% for 2°C global warming). Projections suggest that the most intense events (category 4 and 5) will become more frequent (although these projections are particularly sensitive to the spatial resolution of the models). It is also likely that average precipitation rates within 100 km of the storm centre will increase – by a maximum of about 10% per degree of warming. Such increases in rainfall rate would be exacerbated if tropical cyclone translation speeds continue to slow (4–11).7 7Information and understanding about tropical cyclones (including hurricane and typhoons) from observations, theory and climate models have improved in the past few years. It is difficult to make robust projections for specific ocean basins or for changes in storm tracks. Presented here is a synthesis of the expected changes at the global scale.
Sea level rise is one of the most significant threats to low-lying areas on small islands and atolls. Research indicates that rates of global mean sea level rise are almost certainly accelerating as a result of climate change. The relatively long response times to global warming mean that sea level will continue to rise for a considerable time after any reduction in emissions. The continuing rise in sea level means that higher storm surge levels can be expected regardless of any other changes in the characteristics of storm surges.
Potential impacts of sea level rise include:
Some of the world’s most virulent infections are also highly sensitive to climate: temperature, precipitation and humidity have a strong influence on the life-cycles of the vectors and the infectious agents they carry and influence the transmission of water- and foodborne diseases (21,22). Small island developing States (SIDS) are vulnerable to disease outbreaks. Climate change could affect the seasonality of such outbreaks, as well as the transmission of vector-borne diseases (23–26).
Small island developing States (SIDS) face distinct challenges that render them particularly vulnerable to the impacts of climate change on food and nutrition security including: small, and widely dispersed, land masses and population; large rural populations; fragile natural environments and lack of arable land; high vulnerability to climate change, external economic shocks, and natural disasters; high dependence on food imports; dependence on a limited number of economic sectors; and distance from global markets. The majority of SIDS also face a “tripleburden” of malnutrition whereby undernutrition, micronutrient deficiencies and overweight and obesity exist simultaneously within a population alongside increasing rates of diet-related NCDs.
Climate change is likely to exacerbate the tripleburden of malnutrition and the metabolic and lifestyle risk factors for diet-related NCDs. It is expected to reduce short- and long-term food and nutrition security both directly, through its effects on agriculture and fisheries, and indirectly, by contributing to underlying risk factors such as water insecurity, dependency on imported foods, urbanization and migration and health service disruption. These impacts represent a significant health risk for SIDS, with their particular susceptibility to climate change impacts and already over-burdened health systems, and this risk is distributed unevenly, with some population groups experiencing greater vulnerability.
The following section measures progress in the health sector in responding to climate threats based on country reported data collected in the 2021 WHO Health and Climate Change Country Survey (19).
| Question | questioncategory | question | Answer |
|---|---|---|---|
| Has a national health and climate change strategy or plan been developed ? | YES | ||
| Are the health co-benefits of climate change mitigation action considered in the strategy/plan? | NO | ||
| Level of implementation of the strategy/plan? | LOW | ||
| Portion of estimated costs to implement the strategy/plan covered in the health budget | NO | ||
| Are health adaptation priorities identified in the strategy/plan? | YES |
Is there an agreement in place between the ministry of health and this sector which defines specific roles and responsibilities in relation to links between health and climate change policy?
| Question | questioncategory | question | Answer |
|---|---|---|---|
| Is there an agreement in place between the ministry of health and this sector which defines specific roles and responsibilities in relation to links between health and climate change policy? | Transportation | NO | |
| Is there an agreement in place between the ministry of health and this sector which defines specific roles and responsibilities in relation to links between health and climate change policy? | Electricity generation | NO | |
| Is there an agreement in place between the ministry of health and this sector which defines specific roles and responsibilities in relation to links between health and climate change policy? | Household energy | NO | |
| Is there an agreement in place between the ministry of health and this sector which defines specific roles and responsibilities in relation to links between health and climate change policy? | Agriculture | NO | |
| Is there an agreement in place between the ministry of health and this sector which defines specific roles and responsibilities in relation to links between health and climate change policy? | Social services | NO | |
| Is there an agreement in place between the ministry of health and this sector which defines specific roles and responsibilities in relation to links between health and climate change policy? | Water, Sanitation & Waste-water management | NO |
| Question | questioncategory | question | Answer |
|---|---|---|---|
| Has an assessment of health vulnerability and impacts of climate change been conducted at a national level? | YES | ||
| → Level of influence of the assessment findings on policy prioritization to address the health risks of climate change | MINIMAL | ||
| → Level of influence of the assessment findings on human and financial resource allocation to address the health risks of climate change | MINIMAL |
| Climate-sensitive diseases and health outcomes | qid | Health surveillance system is in place (a) | Health surveillance system includes meteorological information (b) |
|---|---|---|---|
| Thermal stress (e.g. heat waves) | 22111 | NO | NO |
| Vector-borne diseases | 22121 | YES | YES |
| Foodborne diseases | 22131 | YES | NO |
| Waterborne diseases | 22141 | YES | YES |
| Nutrition (e.g. malnutrition associated with extreme-climatic events) | 22151 | YES | |
| Injuries (e.g. physical injuries or drowning in extreme weather events) | 22161 | YES | YES |
| Mental health and well-being | 22171 | NO | NO |
| Airborne and respiratory diseases | 22181 | YES |
| Climate hazard | qid | Health early warning system (HEWS) in place? | Health sector response plan in place? | Health sector response plan includes meteorological information? |
|---|---|---|---|---|
| Heat waves | 23111 | |||
| Storms (e.g. hurricanes, monsoons, typhoons) | 23131 | |||
| Flooding | 23141 | |||
| Drought | 23161 | |||
| Air quality (e.g. particulate matter, ozone levels) | 23171 |
| Question | questioncategory | question | Answer |
|---|---|---|---|
| Is there a national curriculum developed to train health personnel on the health impacts of climate change? | YES | ||
| Does your human resource capacity as measured through the International Health Regulations Monitoring Framework (IHR) adequately consider the human resource requirements to respond to climate-related events? | NO |
| Question | questioncategory | question | Answer |
|---|---|---|---|
| Has there been a national assessment of the climate resilience of health infrastructure and technology? | |||
| Have measures been taken to increase the climate resilience of health infrastructure and technology? | |||
| Is there a national initiative/programme in place to promote the use of low-carbon, energy-efficient, sustainable technologies in the health sector? |
| Question | questioncategory | question | Answer |
|---|---|---|---|
| Is your government currently accessing international funds to support climate change and health work? | NO |
Greatest challenges faced in accessing international climate funds
| Question | questioncategory | question | Answer |
|---|---|---|---|
| Greatest challenges faced in accessing international climate funds | Lack of information on the opportunities | ||
| Greatest challenges faced in accessing international climate funds | Lack of country eligibility | ||
| Greatest challenges faced in accessing international climate funds | Lack of connection by health actors to climate change processes | ||
| Greatest challenges faced in accessing international climate funds | Lack of capacity to prepare country proposals | YES | |
| Greatest challenges faced in accessing international climate funds | Lack of success in submitted applications | YES | |
| Greatest challenges faced in accessing international climate funds | None (no challenges/challenges were minimal) | ||
| Greatest challenges faced in accessing international climate funds | Not applicable | ||
| Greatest challenges faced in accessing international climate funds | Other (please specify) |
Madagascar has an adaptation strategic plan for health sector to climate change, which was published in May 2021. Implementation of the health and climate change plan in Madagascar is reported to be low. Assess barriers to implementation of the plan/strategy (e.g. governance, evidence, monitoring and evaluation, finance). Implementation can be supported by exploring additional opportunities to access funds for health and climate change priorities (e.g. GCF readiness proposal).
Madagascar has a health and climate change working group, made up of key players in the health sector and the meteorological sector. This working group is headed jointly by the Director General of Meteorology and the health sector coordinator. Efforts should be made to strengthen collaborations with this health and climate change working group, to undertake and promote research on health and climate change in Madagascar.
Madagascar published a vulnerability and adaptation capacity assessment in 2015. Efforts should be made to update this assessment.
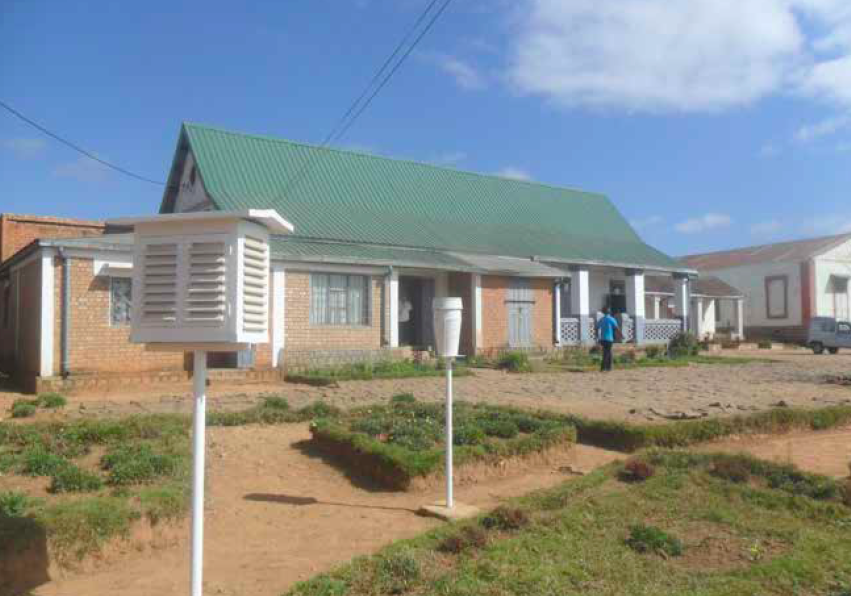
Climatic and meteorological information and parameters are used in Madagascar to produce and regularly distribute the climatology health bulletin. Effective early warning systems are required at the health district level regarding health and climate change risks.
Measures can be taken to prevent the potentially devastating impacts of climate change on health service provision. A commitment towards climate-resilient, environmentally sustainable health systems can improve system stability, promote a healing environment and mitigate climate change impacts.
WHO/HEP/ECH/CCH/21.01.08
© World Health Organization and the United Nations Framework Convention on Climate Change, 2021
Some rights reserved. This work is available under the CC BY-NC-SA 3.0 IGO licence
All reasonable precautions have been taken by WHO and UNFCCC to verify the information contained in this publication. However, the published material is being distributed without warranty of any kind, either expressed or implied. The responsibility for the interpretation and use of the material lies with the reader. In no event shall WHO and UNFCCC be liable for damages arising from its use.
Most estimates and projections provided in this document have been derived using standard categories and methods to enhance their cross-national comparability. As a result, they should not be regarded as the nationally endorsed statistics of Member States which may have been derived using alternative methodologies. Published official national statistics, if presented, are cited and included in the reference list.
Design by Inís Communication from a concept by N. Duncan Mills
Photos: Rod Waddington / Flickr