Strengthen the Implementation of the Climate Change and Health Strategic Action Plan for Fiji
Fiji has an approved national Climate Change and Health Strategic Action Plan 2016–2020, which is being implemented within limited resources.
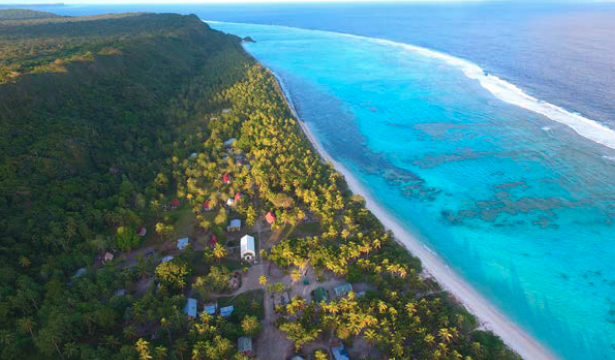
The island nation of the Republic of Fiji in the South Pacific Ocean is an upper middle-income country rich in natural resources. The oceanic tropical marine climate means the country experiences warm weather all year round with minimal temperature extremes and variable rainfall that is slightly higher in the warmest months. Most of the land comprises volcanic islands, and the country experiences a range of natural hazards including earthquakes, landslides, cyclones, flooding and storm surges (1).
Though Fiji contributes minimally to global greenhouse gas emissions, this small island developing state is vulnerable to the effects of climate change. Fiji is already experiencing rising sea levels, coastal erosion, water shortages, salination of water supplies, depleted fishery stocks, large-scale flooding and an increase in vector-borne diseases (1) – all of which will likely increase as the effects of climate change become more pronounced. Furthermore, internal displacement as a result of climate is already being experienced in Fiji.
The Fiji Ministry of Health has been working to increase its capacity to monitor, assess and respond to hydro-meteorological disasters and climate sensitive diseases to reduce the health risks associated with climate change. Fiji has committed to reducing emissions by up to 30% against a business as usual level, and increasing electricity generation through renewable energy from 60% (2013) to 100% by 2030 (1).
Country-specific projections are outlined up to the year 2100 for climate hazards under a ‘business as usual’ high emissions scenario compared to projections under a ‘two-degree’ scenario with rapidly decreasing global emissions (see Figures 1–5). The climate model projections given below present climate hazards under a high emissions scenario, Representative Concentration Pathway 8.5 (RCP8.5 – in orange) and a low emissions scenario (RCP2.6 – in green). 1 1Model projections are from CMIP5 for RCP8.5 (high emissions) and RCP2.6 (low emissions). Model anomalies are added to the historical mean and smoothed.
The text describes the projected changes averaged across about 20 global climate models (thick line). The figures 2 2Analysis by the Climatic Research Unit, University of East Anglia, 2018. also show each model individually as well as the 90% model range (shaded) as a measure of uncertainty and the annual and smoothed observed record (in blue).3 3Observed historical record of mean temperature is from CRU-TSv3.26 and total precipitation is from GPCC. Observed historical records of extremes are from JRA55 for temperature and from GPCC-FDD for precipitation. In the following text the present-day baseline refers to the 30-year average for 1981–2010 and the end-of-century refers to the 30-year average for 2071–2100.
Modelling uncertainties associated with the relatively coarse spatial scale of the models compared with that of small island States are not explicitly represented. There are also issues associated with the availability and representativeness of observed data for such locations.
Under a high emissions scenario, the mean annual temperature is projected to rise by about 2.7ºC on average by the end-of-century (i.e. 2071–2100 compared with 1981–2010). If emissions decrease rapidly, the temperature rise is limited to about 0.7ºC.
Total annual precipitation is projected to remain almost unchanged on average under a high emissions scenario, although the uncertainty range is large (-47% to +31%). If emissions decrease rapidly there is little projected change on average, with an uncertainty range of -23% to +9%.
The percentage of hot days4 4A ‘hot day’ (‘hot night’) is a day when maximum (minimum) temperature exceeds the 90th percentile threshold for that time of the year. is projected to increase substantially from about 20% of all days on average in 1981–2010 (10% in 1961–1990). Under a high emissions scenario, almost 100% of days on average are defined as ‘hot’ by the end-of-century. If emissions decrease rapidly, about 55% of days on average are ‘hot’. Note that for the last few years the models tend to overestimate the observed increase in hot days. Similar increases are seen in hot nights (4) (not shown).
Under a high emissions scenario, the proportion of total annual rainfall from very wet days5 5The proportion (%) of annual rainfall totals that falls during very wet days, defined as days that are at least as wet as the historically 5% wettest of all days about 30% for 1981–2010) could increase a little by the end-of-century (to about 35% on average with an uncertainty range of about 15% to 50%), with little change if emissions decrease rapidly. These projected changes are accompanied by little or no change in total annual rainfall even under a high emissions scenario (see Figure 2).
The Standardized Precipitation Index (SPI) is a widely used drought index which expresses rainfall deficits/excesses over timescales ranging from 1 to 36 months (here 12 months, i.e. SPI12).6 6SPI is unitless but can be used to categorize different severities of drought (wet): above +2.0 extremely wet; +2.0 to +1.5 severely wet; +1.5 to +1.0 moderately wet; +1.0 to +0.5 slightly wet; +0.5 to -0.5 near normal conditions; -0.5 to -1.0 slight drought; -1.0 to -1.5 moderate drought; -1.5 to -2.0 severe drought; below -2.0 extreme drought. It shows how at the same time extremely dry and extremely wet conditions, relative to the average local conditions, change in frequency and/or intensity.
SPI12 values for Fiji show little projected change from an average of about -0.4, indicating little change on average in the frequency and/or intensity of wet episodes and drought events, though year-to-year variability remains large. A few models indicate larger decreases (more frequent/intense drought events) or increases (more frequent/intense wet events).
Tropical cyclones normally affect Fiji between November and April, although during El Nino years tropical cyclones can also occur in October and May. Between 1969/70 and 2010/11, 117 tropical cyclones crossed the Fiji Exclusive Economic Zone (EEZ). This represents an average of 28 cyclones per decade. Interannual variability in the number of tropical cyclones in the Fiji EEZ is large (3).
Sea level rise is one of the most significant threats to low-lying areas on small islands and atolls. Research indicates that rates of global mean sea level rise are almost certainly accelerating as a result of climate change. A further 0.4–0.9m rise is expected in Fiji by 2090 (3)7 7Estimates of mean net regional sea level change were evaluated from 21 CMIP5 models and include regional non-scenario components (adapted from WGI AR5 Figure 13–20). The range given is for RCP4.5 annual projected change for 2081–2100 compared to 1986–2005. under a high emissions scenario (RCP8.5), with variation amongst models and emissions scenarios.
The relatively long response times to global warming mean that sea level will continue to rise for a considerable time after any reduction in emissions.
Potential impacts of sea level rise include:
Some of the world’s most virulent infections are also highly sensitive to climate: temperature, precipitation and humidity have a strong influence on the life-cycles of the vectors and the infectious agents they carry, and influence the transmission of water- and foodborne diseases (21,22).
Small island developing States (SIDS) are vulnerable to disease outbreaks. Climate change could affect the seasonality of such outbreaks, as well as the transmission of vector-borne diseases. The seasonality and prevalence of dengue transmission may change with future climate change, but Fiji is consistently highly suitable for dengue transmission under all scenarios and thus vulnerable to outbreaks (23–26).8 8Given the climate dependence of transmission cycles of many vector-borne diseases, seasonality of epidemic risk is common; however, many SIDS, due to tropical latitudes, tend to have less seasonality than more temperate areas.9 9The actual occurrences/severity of epidemics would be quite different for each disease in each setting and could depend greatly on vector- and host-related transmission dynamics, prevention, surveillance and response capacities that are not captured in this model.
Small island developing States (SIDS) face distinct challenges that render them particularly vulnerable to the impacts of climate change on food and nutrition security including: small, and widely dispersed, land masses and populations; large rural populations; fragile natural environments and lack of arable land; high vulnerability to climate change, external economic shocks, and natural disasters; high dependence on food imports; dependence on a limited number of economic sectors; and distance from global markets. The majority of SIDS also face a ‘triple-burden’ of malnutrition whereby undernutrition, micronutrient deficiencies and overweight and obesity exist simultaneously within a population, alongside increasing rates of diet-related NCDs.
Climate change is likely to exacerbate the triple-burden of malnutrition and the metabolic and lifestyle risk factors for diet-related NCDs. It is expected to reduce short- and long-term food and nutrition security both directly, through its effects on agriculture and fisheries, and indirectly, by contributing to underlying risk factors such as water insecurity, dependency on imported foods, urbanization and migration and health service disruption. These impacts represent a significant health risk for SIDS, with their particular susceptibility to climate change impacts and already over-burdened health systems, and this risk is distributed unevenly, with some population groups experiencing greater vulnerability.
The following section measures progress in the health sector in responding to climate threats based on country reported data collected in the 2021 WHO Health and Climate Change Country Survey (19).
| Question | questioncategory | question | Answer |
|---|---|---|---|
| Has a national health and climate change strategy or plan been developed ? | YES | ||
| Are the health co-benefits of climate change mitigation action considered in the strategy/plan? | YES | ||
| Level of implementation of the strategy/plan? | MEDIUM | ||
| Portion of estimated costs to implement the strategy/plan covered in the health budget | NO | ||
| Are health adaptation priorities identified in the strategy/plan? | YES |
Is there an agreement in place between the ministry of health and this sector which defines specific roles and responsibilities in relation to links between health and climate change policy?
| Question | questioncategory | question | Answer |
|---|---|---|---|
| Is there an agreement in place between the ministry of health and this sector which defines specific roles and responsibilities in relation to links between health and climate change policy? | Transportation | NO | |
| Is there an agreement in place between the ministry of health and this sector which defines specific roles and responsibilities in relation to links between health and climate change policy? | Electricity generation | NO | |
| Is there an agreement in place between the ministry of health and this sector which defines specific roles and responsibilities in relation to links between health and climate change policy? | Household energy | NO | |
| Is there an agreement in place between the ministry of health and this sector which defines specific roles and responsibilities in relation to links between health and climate change policy? | Agriculture | NO | |
| Is there an agreement in place between the ministry of health and this sector which defines specific roles and responsibilities in relation to links between health and climate change policy? | Social services | NO | |
| Is there an agreement in place between the ministry of health and this sector which defines specific roles and responsibilities in relation to links between health and climate change policy? | Water, Sanitation & Waste-water management | YES |
| Question | questioncategory | question | Answer |
|---|---|---|---|
| Has an assessment of health vulnerability and impacts of climate change been conducted at a national level? | NO | ||
| → Level of influence of the assessment findings on policy prioritization to address the health risks of climate change | N/A | ||
| → Level of influence of the assessment findings on human and financial resource allocation to address the health risks of climate change | N/A |
| Climate-sensitive diseases and health outcomes | qid | Health surveillance system is in place (a) | Health surveillance system includes meteorological information (b) |
|---|---|---|---|
| Thermal stress (e.g. heat waves) | 22111 | N/A | N/A |
| Vector-borne diseases | 22121 | YES | YES |
| Foodborne diseases | 22131 | NO | NO |
| Waterborne diseases | 22141 | NO | NO |
| Nutrition (e.g. malnutrition associated with extreme-climatic events) | 22151 | NO | |
| Injuries (e.g. physical injuries or drowning in extreme weather events) | 22161 | NO | NO |
| Mental health and well-being | 22171 | NO | NO |
| Airborne and respiratory diseases | 22181 | NO |
| Climate hazard | qid | Health early warning system (HEWS) in place? | Health sector response plan in place? | Health sector response plan includes meteorological information? |
|---|---|---|---|---|
| Heat waves | 23111 | N/A | N/A | N/A |
| Storms (e.g. hurricanes, monsoons, typhoons) | 23131 | YES | YES | NO |
| Flooding | 23141 | YES | YES | NO |
| Drought | 23161 | YES | YES | NO |
| Air quality (e.g. particulate matter, ozone levels) | 23171 |
| Question | questioncategory | question | Answer |
|---|---|---|---|
| Is there a national curriculum developed to train health personnel on the health impacts of climate change? | NO – UNDER DEVELOPMENT | ||
| Does your human resource capacity as measured through the International Health Regulations Monitoring Framework (IHR) adequately consider the human resource requirements to respond to climate-related events? | Partially |
| Question | questioncategory | question | Answer |
|---|---|---|---|
| Has there been a national assessment of the climate resilience of health infrastructure and technology? | |||
| Have measures been taken to increase the climate resilience of health infrastructure and technology? | |||
| Is there a national initiative/programme in place to promote the use of low-carbon, energy-efficient, sustainable technologies in the health sector? |
| Question | questioncategory | question | Answer |
|---|---|---|---|
| Is your government currently accessing international funds to support climate change and health work? | YES |
Greatest challenges faced in accessing international climate funds
| Question | questioncategory | question | Answer |
|---|---|---|---|
| Greatest challenges faced in accessing international climate funds | Lack of information on the opportunities | NO | |
| Greatest challenges faced in accessing international climate funds | Lack of country eligibility | ||
| Greatest challenges faced in accessing international climate funds | Lack of connection by health actors to climate change processes | NO | |
| Greatest challenges faced in accessing international climate funds | Lack of capacity to prepare country proposals | ||
| Greatest challenges faced in accessing international climate funds | Lack of success in submitted applications | YES | |
| Greatest challenges faced in accessing international climate funds | None (no challenges/challenges were minimal) | ||
| Greatest challenges faced in accessing international climate funds | Not applicable | ||
| Greatest challenges faced in accessing international climate funds | Other (please specify) | recognition |
Fiji has an approved national Climate Change and Health Strategic Action Plan 2016–2020, which is being implemented within limited resources.
Conduct a national assessment of climate change impacts, vulnerability and adaptation for health, including climate resilient and environmentally sustainable health care facilities. Ensure that results of the assessment are used for policy prioritization and the allocation of human and financial resources in the health sector.
Integrate foodborne and waterborne diseases, nutrition, injuries and mental health issues related to climate change into existing monitoring systems and improve the use of meteorological information in these systems.
The main barriers have been identified as a lack of information on the opportunities and a lack of connection by health actors to climate change processes.
WHO/HEP/ECH/CCH/21.01.01
© World Health Organization and the United Nations Framework Convention on Climate Change, 2021
Some rights reserved. This work is available under the CC BY-NC-SA 3.0 IGO licence
All reasonable precautions have been taken by WHO and UNFCCC to verify the information contained in this publication. However, the published material is being distributed without warranty of any kind, either expressed or implied. The responsibility for the interpretation and use of the material lies with the reader. In no event shall WHO and UNFCCC be liable for damages arising from its use.
Most estimates and projections provided in this document have been derived using standard categories and methods to enhance their cross-national comparability. As a result, they should not be regarded as the nationally endorsed statistics of Member States which may have been derived using alternative methodologies. Published official national statistics, if presented, are cited and included in the reference list.
Design by Inís Communication from a concept by N. Duncan Mills
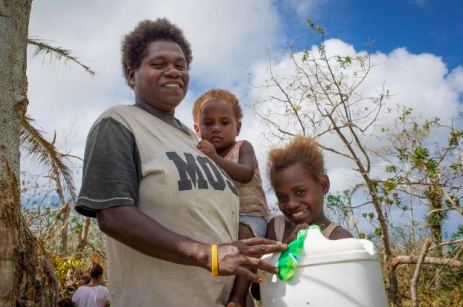
Photos: Ministry of Health and Medical Services Fiji